NATS needed a data visualisation tool to enable their teams to easily track and present the progress of various R&D projects in an engaging way. The tool needed to give a high-level view of how all active projects were currently progressing. A detailed view of each project was also required to gain insights into its performance over time along with associated asset uploads available for download.
There are a huge number of data visualisation tools on the market and 99% of them follow the same formula, a few graphs with key trends and some pie charts of progress of metrics that fit in the format. A lot of the time this is exactly what is needed but for tracking multiple projects in a single view it was cumbersome. We wanted to deliver something that was more tailored to NATS’s individual use case and easily interpreted at a glance.
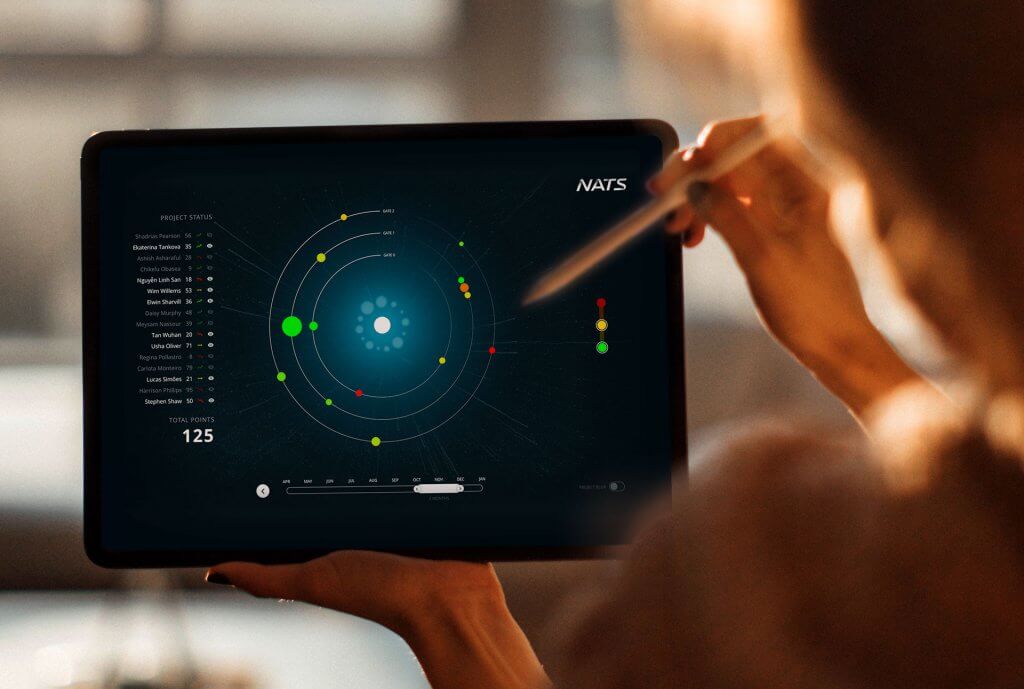
The resulting product development lifecycle tracking system is based on a series of concentric orbits or gates around a centralised backlog of future work. Each project is given a weight relative to commercial value and as it progresses through each gate a custom algorithm calculates its performance giving clear visual representations of how each project is tracking.
Each project can have assets attached which are stored securely using GCP storage buckets and are returned based on stringent authentication checks. Putting all this data at the teams fingertips allows them to interpret and make decisions based on these metrics, facilitating quicker decision making.